| SUNDAY, OCTOBER 25, 2026 / 10-MINUTE READ | CASH & CHAOSMARKETS, MONEY AND THE MADNESS IN BETWEEN. | |
In partnership with

Good morning. This week’s earnings tests are about the quality of growth. Microsoft, Alphabet and Amazon must connect AI demand with profits and cash. Sandisk faces a pricing test, while SoFi and Robinhood need to show how durable their expanding businesses have become.
We have eight company previews, followed by a compact calendar for October 26–30. The figures below describe prior results or explicitly labeled guidance; the coming week’s results have not been released.
|
|
Microsoft’s AI growth has a cash-flow test. |  | Coolcaesar / Wikimedia. Redmond, 2016. · CC BY-SA 4.0
Microsoft enters Wednesday’s earnings with strong demand already established. The harder question is how much cash that demand leaves behind. In the June quarter, revenue rose 18% to $90.0 billion and operating income reached $40.6 billion. Azure and other cloud services grew 43% under the reporting presentation used in that release.
The investment bill moved faster: cash additions to property and equipment reached $35.8 billion, versus $17.1 billion a year earlier. That is roughly a doubling. This cash-flow line is narrower than capital spending measures that also include finance leases, so the two should not be compared interchangeably.
Microsoft also reported $678 billion of commercial remaining performance obligations, up 84%. That strengthens the demand case, but contracted future revenue is neither next-quarter sales nor money already collected.
For the September quarter, the useful comparison is revenue growth against the cost of supplying it. More capacity can unlock customer demand while also increasing depreciation, electricity and operating costs. A faster Azure growth rate would be encouraging; its contribution to profit and cash determines the financial payoff.
Our view: a temporary cash squeeze can be rational when productive assets are being built. The concern would be a pattern in which investment keeps accelerating while incremental operating profit weakens. Wednesday’s guidance should help distinguish a capacity bottleneck being relieved from a permanently more expensive growth model.
|
|
Alphabet’s cloud profits matter more than investment gains. | 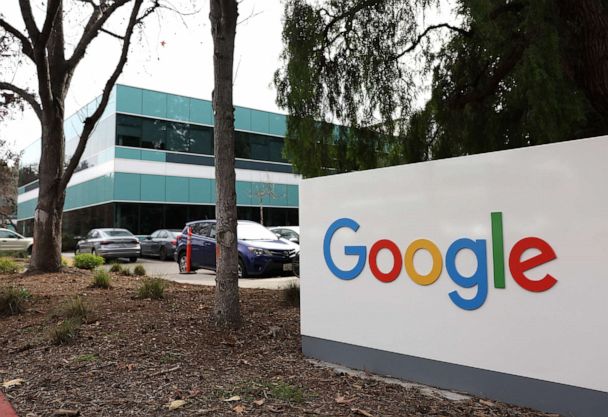 | Justin Sullivan / Getty Images, via ABC News. 2023 archive.
Alphabet’s last quarter showed why headline earnings can obscure the operating story. June-quarter net income available to common shareholders was $112.1 billion, but other income included a $98.0 billion net gain, primarily unrealized gains on equity securities. That is a poor baseline for judging Wednesday’s recurring earnings.
The business itself supplied stronger evidence than a simple EPS comparison: Search revenue grew 17% to $63.3 billion. Google Cloud revenue climbed 82% to $24.8 billion, while Cloud operating income rose from $2.83 billion to $8.81 billion.
That puts Cloud’s operating margin at approximately 35.6%, versus 20.7% a year earlier, calculated from the reported segment figures. Growth accompanied by that much margin expansion is a more meaningful improvement than a mark-up in the value of an investment.
Wednesday tests whether Search stays commercially productive as AI changes how answers are delivered, and whether Cloud can sustain its economics as infrastructure spending flows into expenses. Query growth alone cannot establish monetization or cost per answer.
C&C’s reading: the strongest evidence would be continued Search growth and healthy Cloud operating profit, supported by cash generation. A lower headline EPS caused by smaller investment gains would not, by itself, establish a deteriorating business. Equally, another enormous accounting gain would not settle the question of returns on AI spending.
|
|
Amazon’s cloud engine is strong. Its cash bill is larger. |  | Archive image via Forbes Middle East.
AWS produced about 61% of Amazon’s operating income last quarter from roughly 21% of sales. That makes Thursday’s cloud update disproportionately important, even though the holiday retail outlook will attract plenty of attention.
In the June quarter, AWS revenue rose 37% to $42.2 billion and operating income reached $16.6 billion. The resulting operating margin was approximately 39.4%. Amazon’s consolidated operating income was $27.5 billion; these proportions are calculated from the company’s reported figures.
The cash picture was less comfortable. Trailing twelve-month operating cash flow increased 33% to $161.4 billion, yet free cash flow swung to a $7.6 billion outflow. Amazon attributed the deterioration primarily to higher property-and-equipment purchases, largely for AI.
That is a funding question, not evidence that AWS lacks demand. The important distinction is whether new investment generates enough future cash to justify today’s outlay. Improving operating profits support that case; a widening gap between profits and cash raises the burden of proof.
Retail matters too: North America generated $9.1 billion of operating income. Holiday guidance will test whether sales growth can absorb fulfillment costs.
For this report, we would give more weight to AWS operating income, the investment outlook and retail profitability than to the headline EPS comparison. Last quarter’s net income included $53.4 billion of non-operating pre-tax other income, primarily from Anthropic investments. Those gains cannot be treated as repeatable earnings from selling cloud services or delivering packages.
|
|
Sandisk’s next test is pricing power, not just demand. |  | Sandisk / Wikimedia. Headquarters archive. · CC BY 4.0
Roughly two-thirds of Sandisk’s last sequential revenue increase came from higher pricing; one-third came from volume. Thursday’s results therefore test how durable those prices are, as well as how much storage customers buy.
Fiscal fourth-quarter revenue reached $8.97 billion, up 51% sequentially. Datacenter sales more than doubled to $2.98 billion from $1.47 billion, taking their share of total revenue to approximately 33% from 25%. That is a meaningful shift toward the customers funding the AI buildout.
The picture was not uniformly strong. Consumer revenue fell 32% sequentially to $556 million, while the larger Edge business grew 48% to $5.43 billion. Calling the whole company an AI datacenter business would miss most of its sales.
Management’s fiscal first-quarter guide set revenue at $10.30–$10.80 billion and non-GAAP EPS at $44–$46. The revenue midpoint implies about 18% sequential growth. These are company forecasts, not reported results or a promise about the share price.
Pricing can lift profits quickly because additional revenue does not require an equivalent increase in manufacturing cost. The reverse also matters: weaker prices can compress earnings before shipment volumes look disastrous.
Our interpretation: the more convincing result would combine sustained datacenter growth with evidence that customer agreements support pricing and cash generation. Another large revenue number driven mainly by scarcity would still be profitable, but more exposed to a future supply response. The December-quarter outlook should help show whether the latest step-up is becoming a durable earnings base.
|
|
|
Elon Musk. Jensen Huang. Washington. What’s the Connection?
AI is moving into the physical economy.
Elon is building it. Jensen sees it in Agriculture. Washington is backing it. And DIT AgTech is already putting it to work in livestock.
Most investors haven’t connected the dots yet.
At $1 a share, you still can.
B2B support leaders who made AI work
AI agents are reshaping B2B support, and a few leaders are already ahead. Join Victoria Lowney of Inside Real Estate and Alex Rivas of HoneyBook as they share how they launched, scaled, and what's next. Hear how they built the business case, connected AI to data and systems, and reshaped team roles. Live Q&A. Register now to save your spot and get the recording.
SoFi’s diversification is real. Its software recovery is unfinished. |  | Troutfarm27 / Wikimedia. SoFi Stadium, 2021. · CC BY-SA 4.0
SoFi’s last quarter supports a broader financial-platform story, but not a blanket software-growth story. Tuesday’s report needs to show which parts of that transition are producing durable earnings.
Second-quarter fee-based revenue reached $472.3 million, or 39% of total revenue, up 22% sequentially. Financial Services generated $466.3 million of segment revenue and $212.7 million of contribution profit. These figures describe overlapping views of the business; they must not be added together.
The weaker piece was Technology Platform: revenue of $84.5 million fell 23% year over year, although it improved 13% sequentially. SoFi attributed the annual decline partly to a large client that had fully left before year-end 2025. That is counterevidence to treating every part of the company as a fast-growing technology franchise.
There is a promising customer signal. Existing members opened 51% of new products, versus 35% a year earlier. More products per relationship could spread acquisition costs across additional revenue streams, provided those products remain active and profitable.
Fee income also deserves a closer look. Origination and loan-platform fees are less dependent on holding every loan on SoFi’s balance sheet, but they still depend on borrowers and funding partners. Fee-based does not automatically mean recurring or immune to the credit cycle.
Our focus: whether growth in fees and customer activity translates into GAAP profit without deteriorating loan economics. Stronger Technology Platform results would broaden the case; weaker credit performance could offset progress elsewhere. That combination will say more about the business than another membership milestone or an adjusted-earnings beat on its own.
|
|
Robinhood’s diversification still depends on activity. |  | Robinhood. Toronto office opening, September 2026.
Robinhood grew last quarter despite weaker crypto trading revenue. That is evidence of diversification, although its replacement revenue was not entirely insulated from market activity.
Second-quarter revenue reached $1.31 billion, up 32% year over year. Transaction-based revenue was $776 million, including $342 million from options and $100 million from crypto. Crypto revenue fell 38% from a year earlier. Net interest revenue contributed another $389 million.
The customer base offers a different measure of durability: Robinhood reported $21.7 billion of net deposits and 4.8 million Gold subscribers. Deposits distinguish fresh customer money from asset balances lifted by rising markets. Subscriptions can produce a steadier revenue stream, although they remain a smaller part of the whole business.
Tuesday’s report should therefore be judged on both engagement and retention. A surge in trading can deliver excellent quarterly earnings; keeping customers, attracting assets and increasing paid subscriptions provides a stronger base when activity cools.
There is also an interest-rate trade-off. Lower rates could encourage trading or borrowing while reducing yields earned on some cash balances. We would look for continued deposit growth alongside profitability across revenue streams, rather than assume that a busier app necessarily means a more predictable earnings business.
|
|
Intel needs to turn better factories into better returns. |  | Coolcaesar / Wikimedia. Santa Clara, 2023. · CC BY-SA 4.0
Intel guided third-quarter revenue to $15.8–$16.8 billion and non-GAAP EPS to $0.38. Thursday’s report tests that outlook after June-quarter revenue grew 25% and non-GAAP gross margin reached 41.8%.
Management credited improved factory yields and cycle times, while also signaling higher investment in equipment, clean rooms and substrates. Better yields mean more saleable chips from production; additional capacity still requires money before it earns a return.
The meaningful follow-through would be sustained margins alongside credible foundry economics and manageable cash requirements. Product demand alone cannot establish that manufacturing expansion will generate adequate returns. The operating recovery is encouraging; the investment case still needs both parts of the equation.
|
|
Lilly’s volume surge has to outrun lower prices. |  | Shutterstock, via WFYI. Headquarters archive.
Lilly’s last quarter paired 60% volume growth with a 13% decline in realized prices. Revenue still rose 48% to $23.0 billion. Thursday’s results will show whether that balance remains favorable.
More patients can offset lower revenue per treatment, but the investment payoff also depends on manufacturing costs, product mix and the expense of reaching those patients. Prescription momentum alone does not answer the margin question.
Our focus is whether expanding demand continues to support profit and the full-year outlook. Sustained growth with resilient margins would strengthen the case. Faster volume accompanied by a disproportionately weaker profit outlook would suggest that improving access is coming at a larger economic cost.
|
|
The week ahead: earnings and the economic calendar.Selected major earnings · October 26–30
| Date | Before U.S. open | After U.S. close |
|---|
| Mon, Oct 26 | Verizon | Cadence; Welltower; Nucor | | Tue, Oct 27 | SoFi; Coca-Cola; Boeing; PayPal; UPS | Visa; Robinhood; Seagate; Waste Management | | Wed, Oct 28 | GE Vernova; Vertiv; ADP | Microsoft; Alphabet; KLA; ServiceNow; T-Mobile | | Thu, Oct 29 | Eli Lilly; Mastercard; Merck; Caterpillar | Amazon; Sandisk; Intel; Starbucks; Gilead | | Fri, Oct 30 | ExxonMobil; Chevron; AbbVie; Colgate-Palmolive; Regeneron | — |
Source: Fiscal.ai, refreshed October 25; confirmed financial-results releases, not conference-call times. Selected companies, not every report. — means none selected.
Key U.S. economic events · All times ET
Monday, October 26: Chicago Fed national activity (September), 8:30 a.m.; Dallas Fed manufacturing (October), 10:30 a.m.
Tuesday, October 27: durable-goods orders (September), 8:30 a.m.; FHFA and Case-Shiller home prices (August), 9 a.m.; consumer confidence (October), new-home sales (September) and Richmond Fed manufacturing (October), 10 a.m.
Wednesday, October 28: advance goods trade and retail/wholesale inventories (September), 8:30 a.m.; Fed decision, 2 p.m., followed by the press conference at 2:30 p.m.
Thursday, October 29: advance Q3 GDP; September personal income, spending and PCE inflation; weekly jobless claims — all 8:30 a.m.
Friday, October 30: Q3 Employment Cost Index, 8:30 a.m.; Chicago PMI (October), 9:45 a.m.
Economic dates: publishing agencies and linked release calendars, checked October 25. Schedules can change.
|
|
Forwarded this email? Get Cash & Chaos in your inbox.
Independent market commentary. C&C interpretations are analysis; company guidance is not a guarantee.
|
|
|


