WEDNESDAY, OCTOBER 21, 2026  /  10-MINUTE READ

CASH & CHAOS

MARKETS, MONEY AND THE MADNESS IN BETWEEN.

In partnership with

Good morning. SpaceX’s revenue jumped 161%, but its capital spending was even bigger. Netflix beat its own earnings forecast while cutting its advertising target. AT&T raised its profit outlook without raising this year’s cash-flow floor.

And Elon Musk has put a possible SpaceX–Tesla merger on the table. Below: what the companies delivered, what changed in their outlooks, and where the cash goes next. Supermicro and Salesforce round out the morning with two very different AI bets.

SpaceX revenue jumps 161%. A Tesla merger is on the table.

SpaceX facility in Hawthorne, California

Hawthorne facility, 2012 archive; cropped. SpaceX / Wikimedia, CC0.

SpaceX reported roughly $14.6 billion in quarterly revenue, up 161%, and $4.4 billion in net income. Elon Musk also said SpaceX and Tesla have formed special committees to explore a possible merger, according to CNN’s earnings coverage.

The results are in; a merger is still a proposal. There is no agreed transaction, exchange ratio or completion date. Investors can judge the quarter now, but they cannot yet calculate what combining the businesses would mean for each share.

Musk said he would not participate in the merger decision because of his interests in both companies. Independent review matters here: a deal could benefit one set of shareholders more than the other, depending on the price, financing and ownership split.

Reported earnings were $0.35 per share, versus the $0.14 FactSet expectation cited by CNN. Revenue exceeded the reported $12.9 billion estimate by roughly $1.7 billion, or 13%. The $4.4 billion net profit represents about 30 cents of every revenue dollar, based on the rounded reported figures.

Axios reports quarterly capital spending of $19.59 billion, up from $6.88 billion a year earlier. That is about $5 billion more than revenue. Spending above revenue does not by itself tell us free cash flow, but it shows why net income alone cannot describe the financing burden.

Capital spending rose by $12.71 billion from a year earlier, roughly 185%—faster than revenue. That spending buys assets whose costs can be recognized over many years. The cash leaves sooner. Operating cash flow, rather than net profit, is the starting point for calculating how much outside funding the expansion needs.

The merger question adds a second calculation: who gets what? In a hypothetical all-share deal, the exchange ratio determines how much of the combined company each group owns. Existing debt and future investment commitments matter too. These are mechanics to examine if terms emerge, not details of an announced agreement.

For Tesla holders, the terms would determine their exposure to SpaceX’s assets and spending. SpaceX holders would need to judge the value of what they receive. Musk’s recusal leaves the committees with the central job: negotiating a transaction their respective shareholders can assess on its economics.

Read Musk’s merger comments →

Netflix delivered the quarter. The ad forecast slipped.

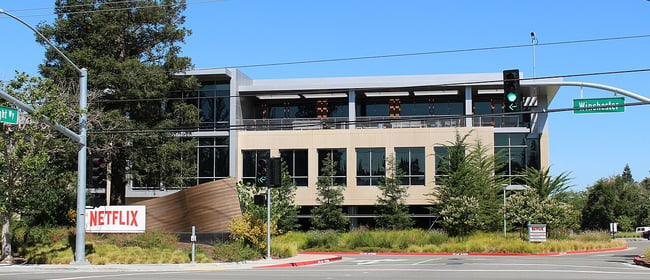
Netflix offices at 101 Albright Way

Netflix offices, archive; cropped. Coolcaesar / Wikimedia · CC BY-SA 4.0.

Netflix earned $0.87 a share on $12.874 billion in revenue. Both exceeded the company’s July forecast. The uncomfortable part arrived in the outlook: expected annual advertising revenue fell to $2.7 billion from roughly $3 billion.

Q3 measureJuly promiseActual
Revenue$12.860B$12.874B
Diluted EPS$0.82$0.87
Operating margin33.2%34.6%

Against management’s July guidance, revenue was just $14 million ahead—about 0.1%. EPS was roughly 6% higher, and operating margin beat the forecast by 1.4 percentage points. Netflix attributed the margin upside primarily to the timing of expenses. This is a comparison with company guidance, not analyst consensus.

That distinction matters. Costs pushed into another quarter can make this quarter look better without increasing the profit available over a full year. Netflix still expects a 31.5% annual operating margin, alongside approximately $51.1 billion in revenue.

The advertising revision removes $300 million, or 10%, from the earlier target. Put against the $51.1 billion annual revenue outlook, that reduction is equivalent to about 0.6% of total sales. It is a much bigger change within the advertising business than across Netflix as a whole.

The fourth-quarter forecast calls for $13.442 billion in revenue, $0.67 EPS and a 26% operating margin. The margin includes an estimated 1.2-percentage-point impact from headcount-reduction costs. That makes the forecast more useful when read with its cost assumptions, rather than as an isolated EPS number.

The Q4 revenue guide is about 4.4% above Q3, while the EPS guide is roughly 23% lower. Higher sales and lower earnings can coexist when costs rise or shift between quarters. That is why extrapolating the strong Q3 margin into year-end would give readers the wrong picture.

Advertising would account for approximately 5.3% of annual revenue at the revised targets. It is still a minority of sales, but an important source of expected growth. The next report needs to show whether the lower target was a reset Netflix can deliver against—and how much it costs to do so.

See Netflix’s Q4 forecast →

AT&T raises its earnings bar. The cash target holds.

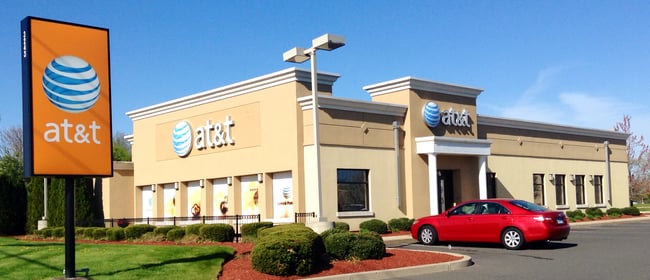
AT&T retail store exterior

AT&T store, 2014 archive; cropped. Mike Mozart / Wikimedia · CC BY 2.0.

AT&T reported $32.3 billion in revenue and $0.65 adjusted EPS this morning. Revenue rose 5.3%, and management lifted its full-year adjusted EPS outlook to approximately $2.40 from $2.25–$2.35.

The new EPS figure is about 4% above the old range’s $2.30 midpoint. That is a clearer improvement than narrowing a range around the same number. Wireless service revenue grew 5%, while advanced home-internet revenue rose 23.4%; the latter includes the acquired Lumen fiber business, so it is not an entirely organic growth rate.

There is a sizeable accounting difference underneath the adjusted result. GAAP EPS was $0.13, affected by a $2.6 billion noncash impairment related to the Mexico business held for sale. The prior year also benefited from a DIRECTV gain. Comparing the two GAAP EPS figures without those items would give a distorted view of the underlying quarter.

For the dividend and buyback story, the cash outlook is more useful. AT&T still expects at least $18 billion in 2026 free cash flow, followed by at least $19 billion in 2027 and $21 billion in 2028. Those are management targets, not cash already collected.

The roughly $10 billion repurchase plan for this year was already part of the second-quarter update. The annual dividend remains $1.11 a share. Neither should be counted as a new shareholder-return announcement in today’s results.

At the $2.40 adjusted EPS outlook, that dividend represents about 46% of adjusted earnings per share. That is an earnings comparison, not a cash-coverage calculation: dividends are paid in cash, and buybacks, debt repayments and other commitments compete for the same pool.

The three annual cash-flow floors also give investors a useful set of milestones. Moving from $18 billion in 2026 to $21 billion in 2028 would represent a $3 billion, or roughly 17%, increase between the stated minimum targets. Actual growth will depend on where each year finishes, because these are floors rather than precise forecasts.

Today’s earnings upgrade is encouraging. For the shareholder-return case to strengthen further, the next improvement needs to appear in cash generation as well. Network growth that absorbs all its extra receipts in investment would leave less room for distributions than the EPS headline suggests.

See the updated cash-flow targets →

Discover laptops with built-in intelligence.

Shift your workforce into hyper-productivity mode with Dell Pro laptops powered by Intel® Core™ Ultra with Intel vPro®. Shop on Dell Premier.

Where big tech finished.

Tuesday, October 20 close · USD · daily change. Mag 7 plus AMD, Broadcom and Micron: our editorial watchlist.

StockCloseDaily
Apple$339.50-1.00%
Microsoft$531.87-0.31%
Nvidia$216.47-0.29%
Amazon$262.63+0.07%
Alphabet$340.27-1.13%
Meta$694.25-1.59%
Tesla$373.71+1.54%
AMD$534.74-0.62%
Broadcom$334.37-0.07%
Micron$896.07-0.98%

Tesla and Amazon were the only gainers in this group. These are regular-session closes, before the evening earnings announcements and merger comments—not this morning’s premarket quotes.

Supermicro adds $4B to its quarterly revenue midpoint.

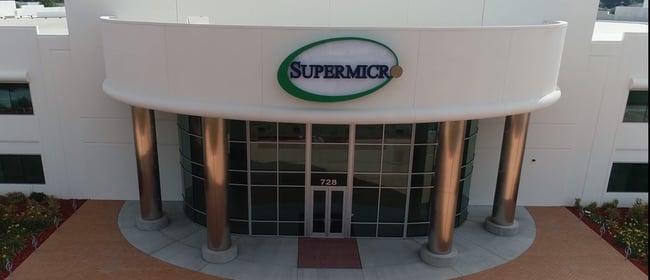
Supermicro Green Computing Park in San Jose

Supermicro campus, 2022 archive; cropped. SMCI / Wikimedia · CC BY-SA 4.0.

Supermicro now expects $18.5–$19.5 billion in fiscal first-quarter revenue, compared with $14.5–$15.5 billion previously. The midpoint rises from $15 billion to $19 billion, a roughly 27% increase.

Preliminary Q1 FY27Previous rangeUpdated range
Revenue$14.5–15.5B$18.5–19.5B
Gross margin10.4–10.8%12.0–12.5%

The margin change is particularly useful. Selling more servers can produce a large revenue number without much extra profit if components and competition consume the difference. Here, management expects a bigger share of each sales dollar to remain after product costs, helped by product and customer mix.

At the midpoints, the figures imply approximately $2.33 billion in gross profit, compared with $1.59 billion under the earlier ranges. That is our illustrative calculation, not a company net-income forecast. Operating expenses, interest and taxes still come out after gross profit.

The difference is about $738 million in illustrative gross profit, or 46%, using unrounded midpoints. To separate the drivers: $19 billion of revenue at the old 10.6% margin would produce about $2.01 billion. Applying the new 12.25% margin adds roughly another $314 million. The mix improvement matters alongside the shipment growth.

Cash collection is a separate test. More deliveries can tie up money in inventory and receivables before customers pay. A larger gross-profit figure therefore does not establish how much cash is available for the next batch of servers. The November report should let investors compare those moving parts.

These figures remain preliminary for the quarter ended September 30. Final results and the November 3 earnings call should clarify expenses and whether the favorable mix will continue.

Compare the revised revenue and margins →

Salesforce puts $5.66B behind AI marketing.

Salesforce Tower in San Francisco

Salesforce Tower, archive; cropped. Salesforce media library.

Salesforce agreed to buy Braze for $47.50 a share in cash, valuing the transaction at approximately $5.66 billion including debt and cash. The target brings customer-engagement software used by more than 2,770 customers.

Braze helps businesses decide when and how to reach people through email, mobile notifications, SMS and other channels. Salesforce wants those capabilities inside its marketing and AI platform, alongside customer data and automated agents.

Consider a retailer trying to bring back a customer who abandoned a purchase. Customer data can identify the opportunity; engagement software can choose a channel and deliver the message. That is an illustration of the commercial pitch, not a claim about a new feature shipped today. Salesforce wants to sell more of that workflow together.

Braze shareholders are being offered cash rather than Salesforce shares, so their proposed consideration is fixed at $47.50 per share. Salesforce shareholders will own the integration challenge: retaining customers and turning the acquired capabilities into enough additional profit to justify the price.

The deal is expected to close in Salesforce’s fiscal 2028, subject to approvals and other conditions. Its fiscal 2027 guidance is unchanged. The purchase therefore does not supply an immediate upgrade to this year’s revenue or earnings forecast.

After closing, the useful evidence will be customer retention and additional sales across the combined products. Integration expenses and overlapping offerings could offset some of those gains. Until that evidence arrives, this is a purchase of future earning capacity, with a clear price tag and a longer timetable.

Read the Braze acquisition terms →

Housing starts lose ground.

September housing starts fell 5.2% to a 1.221 million annualized pace, Census reported Tuesday. Single-family permits declined 4% to 845,000. The headline starts change has a wide error band that includes zero, so one month does not establish a trend.

For builders and suppliers, permits offer another check on future work. Slower activity can pressure volumes even before it shows up in completed-home sales. Read the construction tables.

Traders still favor a Fed pause.

At approximately 7:34 a.m. ET on October 21, Polymarket priced no change in October at 87.5% and a 25-basis-point increase at 11.5%. These are contract prices, not the Fed’s forecast, and the displayed outcomes are not the entire market.

For stocks, the useful comparison is how those odds move as new data arrive. Prices can change before the underlying economic picture becomes clear.

See the odds and resolution rules →

The Street’s changes.

Casella Waste: UBS cut its rating to Neutral from Buy and its target to $95 from $122, citing a weaker acquisition-growth outlook. Reported this morning.

CoreWeave: Piper Sandler lowered its price target to $124, according to this morning’s StreetInsider coverage. This is a target reduction, not a rating downgrade. See the dated analyst update.

Crypto, briefly.

Coinbase spot quotes at approximately 7:34 a.m. ET: Bitcoin $83,396; Ether $2,461. These are point-in-time prices, not daily percentage changes. Coinbase shares finished Tuesday at $170.85, up 1.42%; that stock quote is from the regular-session close. Bitcoin · Ether.

Forwarded this email? Get Cash & Chaos in your inbox.

Independent market commentary. Forecasts and illustrative calculations are not guarantees.