| SUNDAY, NOVEMBER 1, 2026 / 10-MINUTE READ | CASH & CHAOSMARKETS, MONEY AND THE MADNESS IN BETWEEN. | |
Sponsored by

Good morning. Apple, AMD and Palantir give investors a new set of earnings expectations to test this week. The November 2–6 calendar also brings midterm elections Tuesday and the jobs report Friday. A beat against an old guide and support for the next quarter can tell different stories.
|
|
Apple reports Monday with a smaller tariff cushion. |  | Nils Huenerfuerst / Wikimedia Commons. Apple Park, 2024. · License
Mon Nov 2 · after close · call 5 p.m. EST
AAPL: $344.63 · −1.23% Friday. October 30 close.
Apple’s sales expectations fit its existing guidance. Its margin comparison is less comfortable. Ahead of Monday’s fiscal Q4 report, the analyst revenue mean is $112.95 billion, about 10.2% above last year. Management’s July outlook called for 9–11% growth. Adjusted EPS consensus is $1.98.
The more revealing comparison is gross margin. June’s reported 50.1% included roughly two percentage points from tariff refunds. The September-quarter guide was 47–48%, including about one point of refunds. A smaller refund benefit therefore explains part of the expected headline decline.
Management also identified supply constraints affecting iPhone, Mac and iPad, plus a larger memory-cost burden. Those pressures can limit units available to sell or consume more of each sale before it becomes profit. A company can have willing buyers and still earn less on the revenue it ships.
The counterweight is Apple’s existing earnings engine. June revenue grew 16% to $109.4 billion, and Services generated $30.7 billion. Stronger services mix and product pricing can help absorb hardware costs; the results need to establish how much they actually did.
December commentary will carry particular weight because it covers holiday demand. The current analyst revenue mean for that quarter is approximately $152 billion. That is a forecast, not Apple guidance. Our conclusion: a September sales beat would be useful, but a durable improvement requires evidence on margins and available supply as well.
|
|
AMD’s $13 billion guide faces a bigger December hurdle. |  | Coolcaesar / Wikimedia. Santa Clara, 2020 archive. · License
Tue Nov 3 · after close · call 5 p.m. EST
AMD: $504.80 · −10.88% Friday. October 30 close.
Tuesday’s report has two different bars: roughly $13 billion of September-quarter sales and a much larger December expectation. AMD guided Q3 revenue to $13.0 billion, plus or minus $300 million, with approximately 56% non-GAAP gross margin. The analyst means are $13.12 billion of revenue and $1.94 of adjusted EPS.
That revenue estimate is only about 0.9% above management’s midpoint. The current Q4 analyst revenue mean is $16.03 billion—roughly 22% above the Q3 consensus. Meeting the quarter being reported would not, by itself, validate the acceleration analysts expect next.
There is real operating support for that ambition. Q2 Data Center revenue reached $6.7 billion, up 107%, and represented 58% of company sales. But this segment includes EPYC server processors as well as Instinct accelerators. Its growth cannot automatically be read as a pure AI-GPU shipment figure.
Product mix connects those deliveries to earnings. Large rack deployments may lift revenue while changing component costs and the timing of cash collection. The gross-margin result and forward guide help distinguish profitable growth from a larger shipment total. Future customer deployment commitments also become revenue over time, rather than when the partnership headline appears.
AMD fell 10.88% on Friday, before these results. The server franchise is expanding; the next sequential step remains unproven.
|
|
Palantir’s growth bar is already close to management’s guide. | 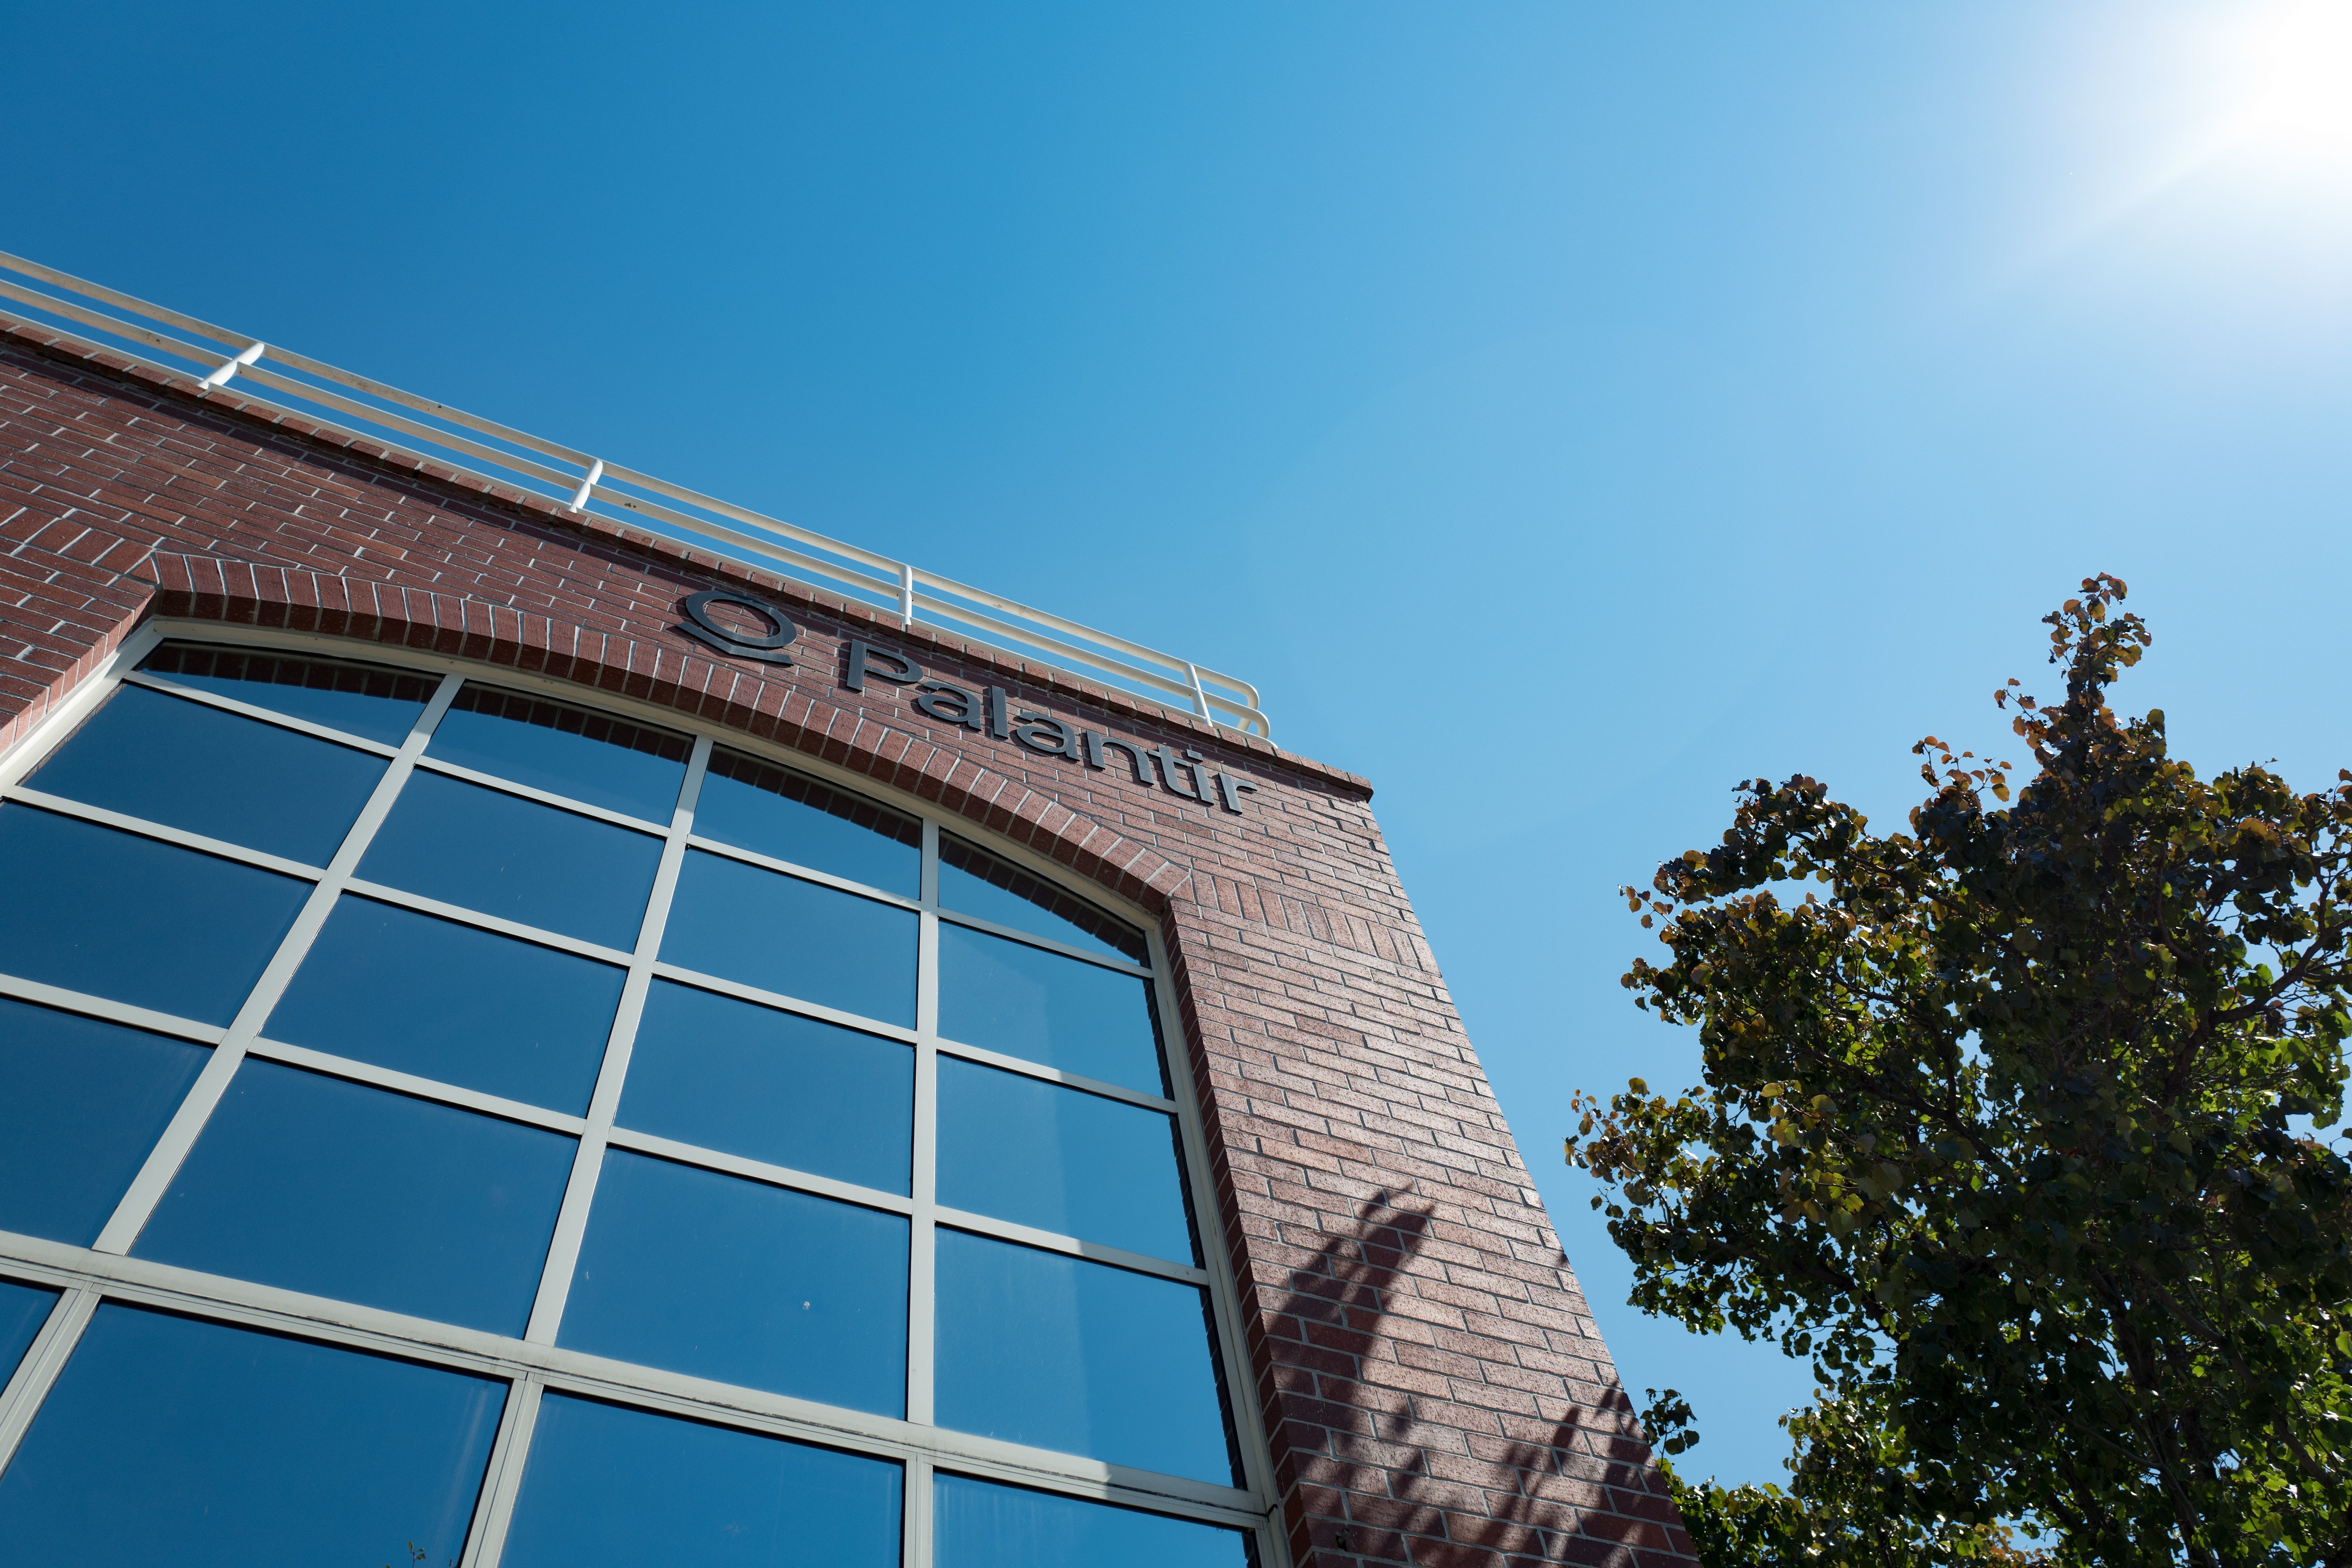 | Smith Collection / Gado / Getty Images, via Axios. Former Palo Alto office, 2020 archive.
Mon Nov 2 · after close · call 5 p.m. EST
PLTR: $184.11 · −6.27% Friday. October 30 close.
A small revenue beat on Monday would clear a narrow numerical gap. Palantir’s Q3 revenue guide is $2.160–$2.164 billion. The analyst mean is $2.171 billion, only about 0.4% above the company midpoint, alongside $0.41 of adjusted EPS. The December-quarter revenue mean is approximately $2.446 billion.
The operating question is whether commercial customers keep turning AI projects into expanding production deployments. Q2 U.S. commercial revenue grew 149% to $764 million, helping total revenue rise 93% to $1.94 billion. Government revenue remains substantial, so total growth alone cannot establish how broadly private-sector demand is spreading.
Contracts provide supporting evidence with different degrees of certainty. Q2 remaining deal value was $13.1 billion, while remaining performance obligations were $4.9 billion. These are different scopes: RPO excludes certain shorter contracts and obligations beyond termination-for-convenience provisions. Neither number is a promise that the entire amount arrives next quarter.
Management’s existing Q3 adjusted operating-income range is $1.292–$1.296 billion. Revenue growth alongside profit and cash generation would strengthen the argument that deployment costs are being absorbed efficiently. The gap between GAAP and adjusted measures still matters when assessing the economics attributable to shareholders.
A stronger December outlook backed by commercial expansion would add more substance than beating the September revenue mean by a few million dollars.
|
|
AppLovin’s 83% margin guide puts cash conversion in focus. | 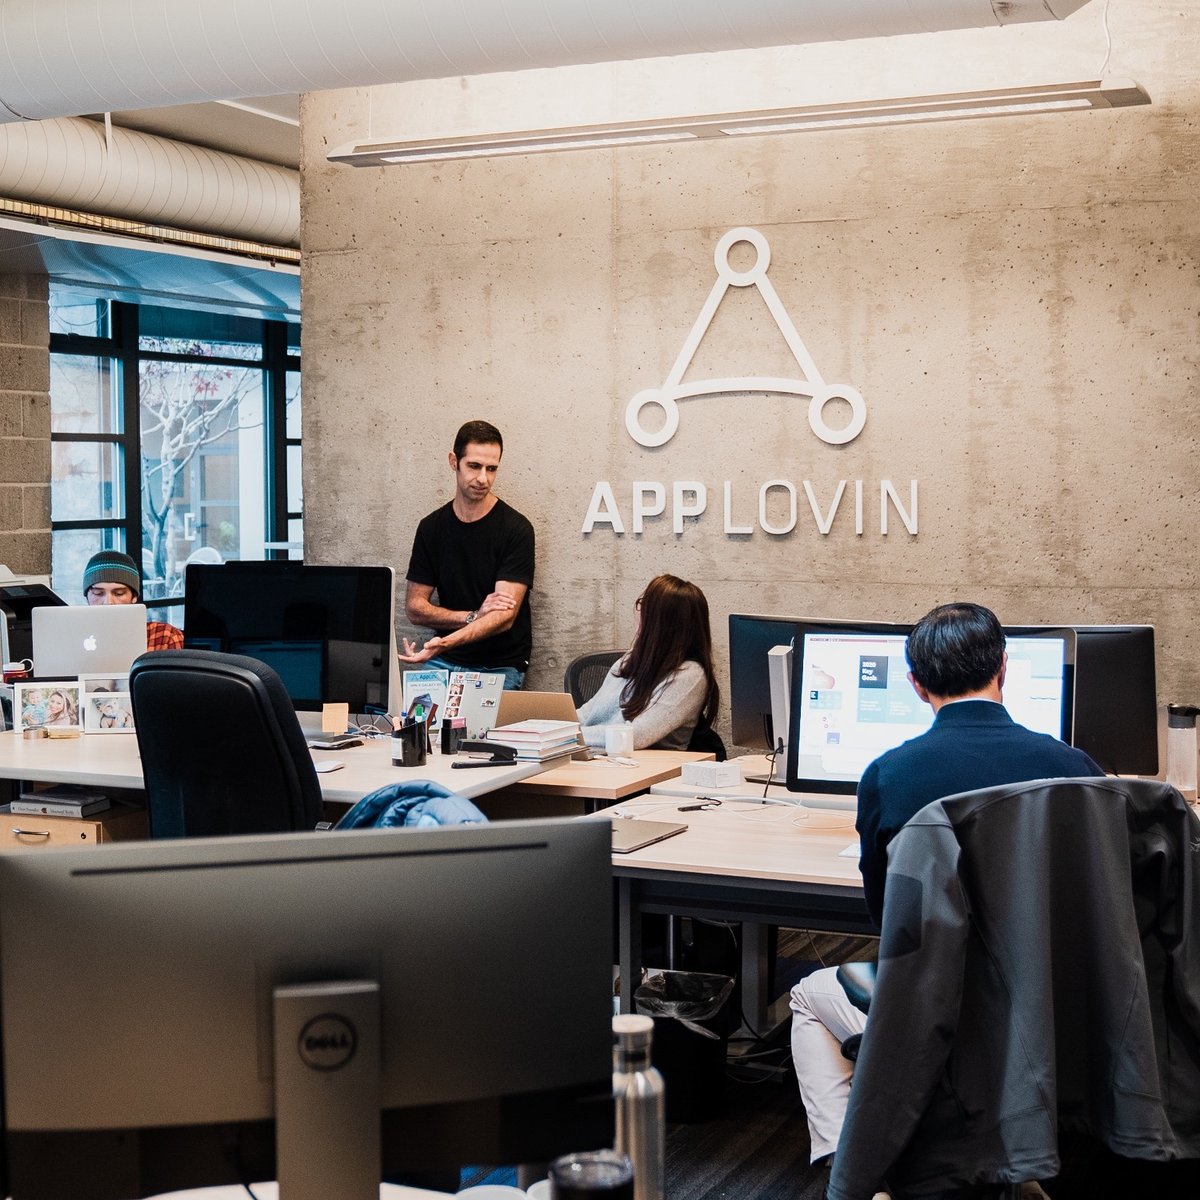 | Courtesy of AppLovin, via Silicon Valley Business Journal. 2025 archive.
Wed Nov 4 · after close · call 5 p.m. EST
APP: $228.50 · −10.36% Friday. October 30 close.
AppLovin enters Wednesday with analyst revenue expectations almost exactly at its own midpoint. The advertising-technology company guided Q3 sales to $2.055–$2.085 billion and adjusted EBITDA to $1.710–$1.740 billion, an approximately 83% margin. Analyst means are $2.077 billion of revenue and $3.94 of adjusted EPS.
That makes cash conversion a useful second lens. Q2 produced $1.924 billion in revenue, $1.614 billion in adjusted EBITDA and $863 million in free cash flow. The cash figure was roughly 53% of adjusted EBITDA; GAAP net income was $1.267 billion. These are three different measures of economic performance, rather than interchangeable descriptions of profit.
AppLovin’s free-cash-flow definition subtracts equipment purchases and finance-lease principal from operating cash. EBITDA excludes taxes, interest and other adjustments. Payment timing can also move cash between quarters. The observed gap does not establish a collection problem, but it does show why an 83% EBITDA margin should not be treated as an 83% cash margin.
The positive case is substantial operating scale: Q2 revenue rose 53%, while adjusted EBITDA increased 58%. If additional advertising demand can run through the existing platform without a matching increase in costs, growth can create considerable incremental profit.
The forward outlook will show how much of that expansion management expects to continue. C&C’s preference is to read the growth rate, reported earnings and cash statement together.
|
|
|
Elon Musk. Jensen Huang. Washington. What’s the Connection?
AI is moving into the physical economy.
Elon is building it. Jensen sees it in Agriculture. Washington is backing it. And DIT AgTech is already putting it to work in livestock.
Most investors haven’t connected the dots yet.
At $1 a share, you still can.
A CRM so smart, it updates itself.
HubSpot's CRM is so smart, it now updates itself. Calls get logged and summarized the moment they end. New leads get researched and a first outreach drafted, automatically. Deals move forward on their own, with next steps flagged before you have to ask.
Even the one repetitive task you've been meaning to fix can now run itself, no code required. Customers using it are already seeing the difference.
This isn't the CRM you have to work hard to figure out. It's the one already working before you log in.
The Mag 7 + three: Friday’s starting point.| Stock | Close | Friday |
|---|
| AAPL | $344.63 | −1.23% | | MSFT | $521.91 | −1.55% | | NVDA | $204.64 | −4.22% | | AMZN | $240.35 | −1.41% | | GOOGL | $279.84 | −1.40% | | META | $614.99 | −1.53% | | TSLA | $399.81 | −0.87% | | AMD | $504.80 | −10.88% | | AVGO | $326.08 | −5.48% | | MU | $884.74 | −5.30% |
USD. October 30 versus October 29 adjusted closes, excluding dividends. Editorial watchlist, not an official index.
The earnings calendar · November 2–6
| Release¹ | Company | Sales est. | EPS est.² |
|---|
| Mon 2 · AC | Apple | $112.95B | $1.98 | | Mon 2 · AC | Palantir | $2.171B | $0.41 | | Tue 3 · BO | Shopify | $3.736B | $0.45 | | Tue 3 · AC | AMD | $13.12B | $1.94 | | Tue 3 · AC | Arista | $3.313B | $1.08 | | Wed 4 · BO | Uber | $14.74B | $0.94 | | Wed 4 · AC | Qualcomm | $10.15B | $2.16 | | Wed 4 · AC | AppLovin | $2.077B | $3.94 |
¹BO: before open; AC: after close. Issuer-confirmed dates. Apple and Qualcomm report fiscal Q4; others Q3. ²USD analyst means, adjusted EPS; Zacks via Fiscal.ai, retrieved November 1. Vendor records updated October 23–31; EPS adjustments can differ from company definitions, particularly Uber.
|
|
Qualcomm’s auto growth still has to offset a larger handset business. |  | Coolcaesar at en.wikipedia / Wikimedia Commons. 2008-02-17. · License
Wed Nov 4 · after close · call 4:45 p.m. EST
QCOM: $164.79 · −11.12% Friday. October 30 close.
Wednesday’s fiscal Q4 report will put Qualcomm’s diversification beside its current earnings base. Management guided revenue to $9.7–$10.5 billion and non-GAAP EPS to $2.05–$2.25. The analyst means—$10.15 billion and $2.16—sit close to the respective midpoints.
The scale comparison matters more than a fast growth percentage in isolation. In fiscal Q3, automotive revenue rose 61% to $1.588 billion, while handset revenue fell 20% to $5.086 billion. Cars were growing rapidly, but handsets still generated more than three times as much revenue. Combined chip-segment sales declined 5%.
Automotive and connected-device demand therefore offer a credible route to a broader business, while phone weakness can still dominate near-term results. Different product margins and the separate patent-licensing business also mean that a dollar of replacement revenue need not replace the same amount of profit.
Qualcomm described a difficult memory and supply environment in July. The new-quarter guide should show whether that pressure is easing. Delivery against the old plan and a stronger forward outlook would establish different kinds of progress.
|
|
Uber’s bookings guide tells more than the revenue headline alone. |  | Getty Images, via ABC News. San Francisco, 2023 archive.
Wed Nov 4 · before open · call 8 a.m. EST
UBER: $65.25 · −0.75% Friday. October 30 close.
Uber’s Wednesday report needs to separate the value of customer spending from the revenue Uber records. Its Q3 gross-bookings guide is $58.25–$60.25 billion, representing 18–22% growth in constant currencies. Analyst revenue consensus is $14.74 billion. Those are different metrics, not competing estimates of the same number.
Q2 illustrates why the distinction matters. Bookings rose 24% in reported dollars, while revenue grew 12%; Uber said business-model changes reduced revenue growth by eight percentage points. A slower reported revenue rate can therefore coexist with stronger activity, rather than automatically signaling a comparable deterioration in rides or deliveries.
Trips increased 18%, and free cash flow was $2.8 billion. Those provide evidence on usage and cash generation alongside the accounting presentation. Mobility, delivery and freight have different economics, so their mix can also change what Uber earns from each dollar of bookings.
Management guided non-GAAP EPS to $0.84–$0.88. The vendor’s adjusted-EPS mean is $0.94, but its generic adjustment definition is not automatically identical to Uber’s. We would compare the reconciliations before calling a beat or miss.
|
|
Midterms Tuesday. Jobs Friday. Plenty in between.ISM manufacturing arrives Monday at 10 a.m.; services follows Wednesday at 10 a.m. Tuesday brings September JOLTS at 10 a.m. and the midterm elections. Thursday’s productivity report is scheduled for 8:30 a.m.; Friday’s October jobs report follows at 8:30 a.m. All times EST.
Hiring and wages affect customer demand and rates. Election results can change the legislative outlook; a projected majority is not an enacted policy.
|
|
Two contracts ahead of election and payrolls risk.The House-control contract priced Democratic control at about 95% when checked November 1; the underlying Yes bid/ask was 94–95¢. It resolves on chamber control under its seat-count and caucus rules, rather than an election-night television call. The December Fed-decision contract displayed roughly 71% for a quarter-point hike and 28% for no change, ahead of the December 8–9 meeting.
November 1 snapshots: House source update 08:16 UTC; Fed page checked 08:55 UTC. Venue prices, not objective probabilities.
|
|
|
Crypto keeps trading while equities wait.Bitcoin traded at $78,078 and Ether at $2,273.67 in Coinbase Exchange spot snapshots timestamped 08:49:33 UTC on November 1. These are venue-specific trades, not Friday closes.
|
|
Forwarded this email? Get Cash & Chaos in your inbox.
Independent market commentary. C&C interpretations are analysis; forecasts and analyst targets are not guarantees.
|
|
|


